 2011 was a year where the internet alongside all of its varied industries have grown tremendously: Whether if its in search that was here pretty much from the beginning, or social networking which now responsible for connecting billions all over the globe, or online videos that became a significant web experience, or eCommerce had its best year ever and also mobile that simply exploded.
My favorite research company, comScore, has released a new thorough report that covering all the meaningful web trends and online insights for 2011 in the United States among all of the industries i listed above. Going over the data can offer better understanding of how the digital world is shaping and what are the directions we are heading to in the future. Here, i will try to summarize the most important stats for 2011:
Social Networking
- 90% of the American internet users have visited social networking site each month where about 17% from all the time spent online dedicated to social networking sites.
- Facebook that preparing for its IPO, shows signs of continuing growth although already reached for approximately 75% of the U.S. internet audience.
- Over the year there was an increase of 32% time spent in Facebook to more than 7 hours for each visitor in December, about 15% of all of the time spent online in general.
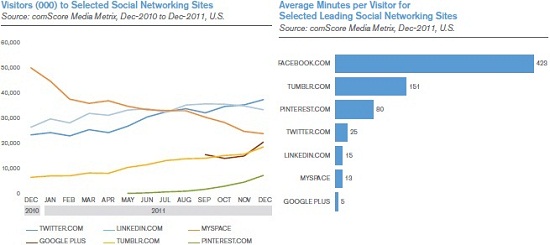
- LinkedIn and Twitter have battled almost all year long for the second most popular social networking site position and as for December Twitter took the lead with 37.5 million visitors while LinkedIn (that just reported to have 150 million members) had 33.5 million visitors.
- MySpace dropped to the fourth position (from second in 2010) with 24 million visitors in December. Google+ entered the fifth position after just launched in June and in December had 20.7 million visitors. Tumblr is sixth with 18.8 million visitors followed by Pinterest with nearly 8 million visitors (already reported to have a big jump in January 2012).
- In terms of engagement users are spending 423 monthly minutes on average in Facebook, 151 minutes in Tumblr, 80 minutes in Pinterest, 25 minutes in Twitter, 15 minutes in LinkedIn, 13 minutes in MySpace and 5 minutes in Google+.

Search
- Google remained the top search engine in 2011, ending the year with 65.9% share of all the searches in December, down from 66.6% in the end of 2010.
- Bing managed to climb for the second most popular search engine after having in December 15.1% share out of all the searches, up from 12% in December 2010. Yahoo dropped to 14.5% share (from 16% in 2010) and to the third place.
- Other search engines also presented a loss of share in 2011- Ask dropped to 2.9% from 3.5% and AOL fell to 1.6% from 1.9%.
- Almost all of the searches online are relying solely on Google and Bing technologies (“powered by” searches)- 68.1% on Google’s and 26.5% on Bing’s.
Online Video
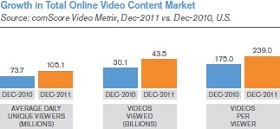
- 105.1 million Americans have watched online videos in December 2011, jump of nearly 43% compared to December 2010.
- 43.5 billion online videos have been watched in December 2011, rise of 44% compared to December 2010.
- Average minutes per video viewer have rose to 5.8 minutes and overall to 239 monthly online videos in December 2011 from 5 minutes and 175 monthly videos in December 2010.
- YouTube is definitely in control over the online video industry where it was responsible for 50.4% of all the videos viewed online in December.

eCommerce
- The total eCommerce spending in the U.S. have summed up to $256 billion in 2011, an increase of 12% from 2010.
- The most heavy online spending months were November ($17.2 billion) and December ($20 billion) during the holiday season.
- The top 3 heavy spending days in 2011 were: Cyber Monday (November 28th) with $1.25 billion, Monday December 5th with $1.18 billion and Green Monday (December 12th) with $1.13 billion.
- The top 5 growing eCommerce categories in 2011 were: Digital content (+26%), consumer electronics (+18%), jewelry (+17%), computer hardware and software (+15%).
- Daily deal sites have peaked in the middle of the year (Groupon with 14.5 million visitors, LivingSocial with 11.2 million visitors) but fell in December (Groupon to 12.5 million visitors, LivingSocial to 4.5 million visitors).